Optimising a 2× GH200 system for Claude Code
Introduction
So you’ve built a €9,000 Grace–Hopper “desktop” (see: my previous post involving 16-million-degree GPU temperatures). Running llama.cpp benchmarks is fine, but the real test of local AI hardware is whether it works as a daily driver. My goal was to serve a 230 Billion Parameter model via vLLM as an OpenAI-compatible API backend to power Claude Code.
This took a week of flag-tweaking and benchmarking, and I learned (again) that the “obvious” configuration choice can be wrong. No hardware caught fire this time (progress!), but I did find some surprisingly sharp edges around tensor parallelism and pipeline parallelism. This post covers what actually worked on two GH200 96GB GPUs with SYS connectivity—including the dead ends.
The setup
Hardware
Same system as before:
- 2x Nvidia Grace-Hopper Superchip
- 2x Nvidia Hopper H100 Tensor Core GPU 96GB of HBM3 memory
- 2x 72-core Nvidia Grace CPU with 480GB of LPDDR5X ECC memory
- Ubuntu 24.04 (aarch64)
- Driver: 580.105.08
- CUDA: 13.0
The important topology detail
nvidia-smi topo -mp reported the GPUs connected as SYS (PCIe + CPU/NUMA fabric), not NVLink. This system was taken from a rack of NVL2 modules and is missing the NVLink hardware.
This matters because tensor-parallel all-reduce performance depends on interconnect speed. The conventional wisdom:
“No NVLink? Use pipeline parallelism to reduce cross-GPU communication.”
That advice can be correct in some setups. On this setup, with this model and engine path, it was wrong—pipeline parallelism introduced other costs (pipeline bubbles, scheduling overhead, and KV/memory headroom issues) that outweighed any comms savings.
The model + workload
- Model:
MiniMax-M2.1-FP8-INT4-AWQ(~140GB weights, local path, custom code) - vLLM: 0.14.0rc1.dev417+g707b240d7 (nightly)
- Serving as an OpenAI-compatible API backend for Claude Code
Requirements:
- Support very long context (up to 163,840 tokens)
- Handle interactive traffic (~4–8 concurrent requests)
- Prioritize low TTFT and stable tail latency
- Keep throughput high enough to feel responsive
Shoutout: mratsim’s 192GB VRAM FrankenQuant
The specific build I’m serving is based on mratsim’s MiniMax-M2.1 mixed-precision “FrankenQuant”, tuned to be “the highest quality quant that can run on 192GiB VRAM” (which is exactly our 2×96GB class of machine).
If you’re trying to run MiniMax-M2.1 on a 2×96GB setup, start there. mratsim also documents why the calibration details matter for MoE models (and why “all experts must be calibrated” is not optional).
Why MiniMax-M2.1 for Claude Code workflows
MiniMax-M2.1 is one of the best “Claude Code-shaped” local models I’ve used: strong coding, solid agent behavior, and it plugs cleanly into tool-using workflows.
MiniMax explicitly positions M2.1 around robustness in coding + tool use, and their own evaluation notes call out Claude Code as scaffolding for multiple benchmarks.
It’s also a sweet spot for this specific box:
- MiniMax-M2.1: 229B params
- GLM-4.7: 358B params
- DeepSeek-V3.2: 685 params
- Kimi K2 Thinking: 1T params
M2.1 is huge, but it’s meaningfully more servable on 2×96GB than the bigger open-weight coding models if you do careful quantisation. The difference in inference speed is >10x, so keeping things in VRAM matters. Unfortunately, both high quantisation and REAP seriously degrade these models.
TL;DR: final settings
These were the best overall settings after running a benchmark matrix (warmup + short prompts at concurrency 4 and 8 + long prompt pressure test):
- Tensor parallel across 2 GPUs:
--tensor-parallel-size 2 - Keep max model length high:
--max-model-len 163840 - Max concurrent sequences:
--max-num-seqs 16(the “felt UX” knob) - Keep vLLM V1 chunked prefill (default; it reported
max_num_batched_tokens=8192) - Avoid pipeline parallelism (PP2) on this stack (big regressions + KV fit issues)
- Avoid FP8 KV cache (quality risk without a real eval harness)
- Disable idle sleep to reduce latency spikes
Final start script
1
2
3
4
5
6
7
8
9
10
11
12
13
14
15
16
17
18
19
20
21
22
23
24
25
26
27
28
29
30
31
32
33
34
35
36
37
38
39
40
41
42
43
44
45
46
#!/usr/bin/env bash
set -euo pipefail

HOST_MODEL_DIR="/path/to/models/MiniMax-M2.1-FP8-INT4-AWQ"
CONTAINER_MODEL_DIR="/models/MiniMax-M2.1-FP8-INT4-AWQ"
MODEL="${CONTAINER_MODEL_DIR}"
MODELNAME="MiniMax-M2.1-FP8"

GPU_UTIL="${GPU_UTIL:-0.95}"
MAX_MODEL_LEN="${MAX_MODEL_LEN:-163840}"
MAX_NUM_SEQS="${MAX_NUM_SEQS:-16}"

SAMPLER_OVERRIDE='{"temperature":1,"top_p":0.95,"top_k":40,"repetition_penalty":1.1,"frequency_penalty":0.40}'

export PYTORCH_ALLOC_CONF="expandable_segments:True,max_split_size_mb:512"
export VLLM_SLEEP_WHEN_IDLE="0"
export VLLM_ALLREDUCE_USE_SYMM_MEM="0"

IMAGE="vllm/vllm-openai:nightly"

docker run --rm --runtime nvidia --gpus '"device=0,1"' \
  -v "${HOST_MODEL_DIR}:${CONTAINER_MODEL_DIR}:ro" \
  -v "${HOME}/.cache/huggingface:/root/.cache/huggingface" \
  -v "${HOME}/.cache/vllm:/root/.cache/vllm" \
  -e PYTORCH_ALLOC_CONF \
  -e VLLM_SLEEP_WHEN_IDLE \
  -e VLLM_ALLREDUCE_USE_SYMM_MEM \
  -p 8000:8000 \
  --ipc=host \
  --entrypoint python3 \
  "${IMAGE}" \
  -m vllm.entrypoints.openai.api_server \
    --host 0.0.0.0 \
    --port 8000 \
    --model "${MODEL}" \
    --served-model-name "${MODELNAME}" \
    --trust-remote-code \
    --gpu-memory-utilization "${GPU_UTIL}" \
    --max-model-len "${MAX_MODEL_LEN}" \
    --tensor-parallel-size 2 \
    --max-num-seqs "${MAX_NUM_SEQS}" \
    --override-generation-config "${SAMPLER_OVERRIDE}" \
    --enable-auto-tool-choice \
    --tool-call-parser minimax_m2 \
    --reasoning-parser minimax_m2_append_think \
    --disable-uvicorn-access-log
Key decisions:
- Tensor parallel (TP2), not pipeline parallel (PP2)
--max-num-seqs 16is the “don’t ruin TTFT under real concurrency” setting- Chunked prefill default was already good
VLLM_SLEEP_WHEN_IDLE=0to avoid “first request after idle” latency spikes
Wiring Claude Code to your local vLLM
Claude Code can be pointed at a local backend by setting the Anthropic base URL + model aliases. I use a wrapper script:
1
2
3
4
5
6
7
8
9
10
11
12
13
14
15
16
17
18
19
#!/usr/bin/env bash
set -euo pipefail

export ANTHROPIC_BASE_URL="http://127.0.0.1:8000"
export ANTHROPIC_API_KEY="local-vllm"

# Force *all* Claude model aliases to your local vLLM model
export ANTHROPIC_MODEL="MiniMax-M2.1-FP8"
export ANTHROPIC_SMALL_FAST_MODEL="MiniMax-M2.1-FP8"
export ANTHROPIC_DEFAULT_HAIKU_MODEL="MiniMax-M2.1-FP8"
export ANTHROPIC_DEFAULT_SONNET_MODEL="MiniMax-M2.1-FP8"
export ANTHROPIC_DEFAULT_OPUS_MODEL="MiniMax-M2.1-FP8"

# Optional but recommended
export CLAUDE_CODE_DISABLE_TELEMETRY=1
export CLAUDE_CODE_DISABLE_NONESSENTIAL_TRAFFIC=1
export API_TIMEOUT_MS=3000000

exec claude "$@"
Why override all model aliases? Claude Code picks a “small/fast” model for parts of the workflow (summaries, lightweight steps). Without overriding those, you’re not benchmarking your local backend consistently.
Why disable nonessential traffic? Keeps the setup quiet and avoids latency surprises from background requests.
Benchmark methodology
Baseline definition
Unless otherwise stated, baseline means:
--tensor-parallel-size 2--max-model-len 163840--gpu-memory-utilization 0.95--max-num-seqs 32- chunked prefill enabled (vLLM V1 default; log reported
max_num_batched_tokens=8192)
Layer 1: API microbench (TTFT + throughput)
I used an async benchmark script that:
- Hits
/v1/chat/completionswithstream=trueto measure TTFT Runs a matrix:
- warmup (short prompt)
- short prompt @ concurrency 4
- short prompt @ concurrency 8
- long prompt @ concurrency 2 (pressure test)
Key metrics:
- Latency p50/p90/p99
- TTFT p50/p90/p99
- Completion tokens/sec (overall and decode-only)
- Effective RPS
Don’t trust a single run. Tail behavior changes depending on compilation caches, prefix cache state, and what happens to land in front of a long prefill chunk. Run multiple iterations.
Layer 2: end-to-end UX bench (Claude Code wall time)
Microbenchmarks measure requests. They don’t measure developer experience.
Claude Code adds overhead:
- project scanning / context assembly
- tool routing logic
- intermediate steps and formatting
- file writes (notes, markdown artifacts)
So I added a second benchmark layer: run Claude Code headlessly on a real repo task and measure wall-clock time.
This is where the optimisation stops being about tok/s and starts being about actual usability.
Flag-by-flag: what mattered and what didn’t
--tensor-parallel-size 2 ✅
What it does: shards model compute across both GPUs.
Why: the model is ~140GB; a single GH200 96GB can’t hold it.
Result: every good configuration used TP=2. Without it, the model can’t load.
--pipeline-parallel-size 2 ❌
This is where I burned a lot of time.
What it does: splits layers across GPUs (pipeline stages) instead of sharding tensors within each layer.
Why it seemed attractive: SYS connectivity suggests slower all-reduce, and guides often recommend PP when interconnect is slow.
What actually happened:
- PP2 couldn’t even start at
max-model-len=163840due to insufficient KV cache memory. - Lowering max length to 114,688 made it start, but performance was dramatically worse.
Important note about apples-to-apples: This isn’t a perfect “PP2 vs TP2 at identical settings” comparison because PP2 couldn’t run at 163k on this system. Even after giving PP2 a shorter max context, it still lost badly on the interactive workload.
Results (PP2 @ max_len=114,688, max_num_seqs=4)
| Metric | PP2 @ 114k | Baseline TP2 @ 163k |
|---|---|---|
| short_c4 throughput | 49.9 tok/s | ~78 tok/s |
| short_c8 throughput | 28.1 tok/s | ~66 tok/s |
| warmup TTFT tails | multi-second | ~0.1s region |
Conclusion: PP2 was a clear loss on this model/engine path. Bench it on your workload—don’t assume topology dictates the answer.
--max-model-len 163840 ✅
What it does: sets maximum supported context length and sizes KV cache planning.
Why I kept it: Claude Code workflows benefit from long-context capability.
Reality check: in the startup log, vLLM printed:
1
2
GPU KV cache size: 235,280 tokens
Maximum concurrency for 163,840 tokens per request: 1.44x
That’s the constraint: you can serve a 163k request, but you cannot serve many of them concurrently. Long context is a capability, not a throughput strategy.
--gpu-memory-utilization 0.95 ✅
What it does: controls how aggressively vLLM uses GPU memory (weights + KV + workspace).
Why 0.95: stable baseline.
What I learned: PP2 failing KV allocation at 163k suggests PP changes memory distribution/headroom enough to break the fit. TP2 at 0.95 was solid.
--max-num-seqs ⚡
This was the most UX-sensitive setting.
What it does: caps how many concurrent sequences the scheduler can admit.
I tested:
- baseline: 32
- candidate: 4
- final: 16
max-num-seqs = 4 was too low
It caused queueing and huge TTFT tails even under moderate concurrency because the scheduler got overly restrictive.
Example from the TP2 seqs=4 run:
- short_c4 avg TTFT: 0.505s (vs ~0.12s)
- short_c4 p99 TTFT: 3.813s (vs sub-second region)
- throughput dropped significantly
max-num-seqs = 16 was the sweet spot
Performance was effectively identical to seqs=32 but with less risk of oversubscription during traffic spikes.
Seqs=16 results
- short_c4 throughput: 78.44 tok/s
- short_c8 throughput: 66.89 tok/s
- TTFT stayed excellent (short_c8 p99 TTFT ~0.213s)
Conclusion: for this workload, 16 is the right value.
Chunked prefill and max_num_batched_tokens ✅
vLLM V1 enabled chunked prefill and reported:
1
Chunked prefill is enabled with max_num_batched_tokens=8192.
I didn’t override it because:
- TTFT was already excellent for short prompts
- chunked prefill makes long-prefill behavior fairer to other concurrent requests
Concurrent partial prefill (--max-num-partial-prefills) ❌
Tried it; vLLM hard-failed:
1
NotImplementedError: Concurrent Partial Prefill is not supported.
Not available on this model/backend path.
FP8 KV cache (--kv-cache-dtype fp8) ⚠️
This is the obvious lever to increase KV capacity (and thus long-context concurrency). I skipped it in the final config because I didn’t want quality regressions without a real evaluation harness.
If you can do A/B evals and correctness tests, FP8 KV is worth exploring.
VLLM_SLEEP_WHEN_IDLE=0 ✅
Avoids sleep mode while idle, which helps reduce “first request after idle” latency spikes for interactive use.
End-to-end UX benchmarking with Claude Code (hyperfine + clean repo state)
Why hyperfine
hyperfine is a CLI benchmark tool that runs commands repeatedly, supports warmups, and reports mean/stddev/min/max runtime.
Useful for: “Did this tuning change make Claude Code feel faster end-to-end?”
Keeping runs comparable: reset the repo between runs
Claude Code can create files. Repo state can drift. Later runs can accidentally benchmark filesystem artifacts instead of the model.
Reset the working tree before each timed run using hyperfine --prepare:
1
2
3
hyperfine --warmup 1 --runs 3 \
  --prepare 'git reset --hard && git clean -ffdx' \
  'claude-minimax --verbose -p "Summarize this repository in 6 bullets. Then list 3 files you would inspect first for request routing." --output-format stream-json > /tmp/claude-run.json'
Notes:
git reset --hardrestores tracked files.git clean -ffdxdeletes untracked files/dirs including ignored ones (-x). Nuclear but consistent.- If you don’t want to wipe heavy ignored caches (
node_modules/,.venv/), usegit clean -ffd.
- If you don’t want to wipe heavy ignored caches (
- Claude Code requires
--verbosewith--output-format stream-json(otherwise it errors).
What the wall-time result looks like
1
2
Time (mean ± σ):     38.994 s ± 13.257 s
Range (min … max):   29.229 s … 54.086 s    3 runs
The big standard deviation is expected: an agent run is multiple requests plus local orchestration, and step count can vary depending on internal decision paths and caching.
This approach measures “felt experience,” not just tokens/sec.
Correlating wall time with vLLM engine stats
While hyperfine measures client-side wall time, vLLM logs help explain what’s happening:
1
2
3
4
Engine 000: Avg prompt throughput: 3805.1 tokens/s, Avg generation throughput: 37.0 tokens/s, Running: 3 reqs, ...
Engine 000: Avg prompt throughput: 12372.3 tokens/s, Avg generation throughput: 164.0 tokens/s, Running: 3 reqs, ...
...
Engine 000: Avg prompt throughput: 0.0 tokens/s, Avg generation throughput: 0.0 tokens/s, Running: 0 reqs, ...
Takeaways:
- Prompt throughput spikes (e.g. ~12k tokens/s) are normal when Claude Code sends bursts and vLLM gets batching/prefix reuse.
- Generation throughput varies because agent workflows mix short control steps with larger responses and occasional long-context calls.
- Prefix caching matters a lot for developer workflows (repeated scaffolding prompts + repeated repo context patterns).
- Hyperfine includes client-side orchestration and any local file I/O—wall time is much larger than a single API call.
Comparison to real Claude
I ran the same benchmark against Anthropic’s Claude API:
1
2
3
hyperfine --warmup 1 --runs 3 \
  --prepare 'git reset --hard && git clean -ffdx' \
  'claude --verbose -p "Summarize this repository in 6 bullets. Then list 3 files you would inspect first for request routing." --output-format stream-json > /tmp/claude-run.json'
Real Claude (Anthropic API):
1
2
Time (mean ± σ):     92.233 s ± 33.328 s
Range (min … max):   54.194 s … 116.310 s    3 runs
Local MiniMax-M2.1:
1
2
Time (mean ± σ):     38.994 s ± 13.257 s
Range (min … max):   29.229 s … 54.086 s    3 runs
The local setup is ~2.4x faster on average for this type of interactive, repo-heavy workflow.
Caveats:
- Real Claude is doing network round-trips (via Starlink, damn you German Fibre providers!)
- Real Claude’s quality is likely higher on complex reasoning
- This comparison is specific to this task
But for this type of work, the local setup is genuinely faster.
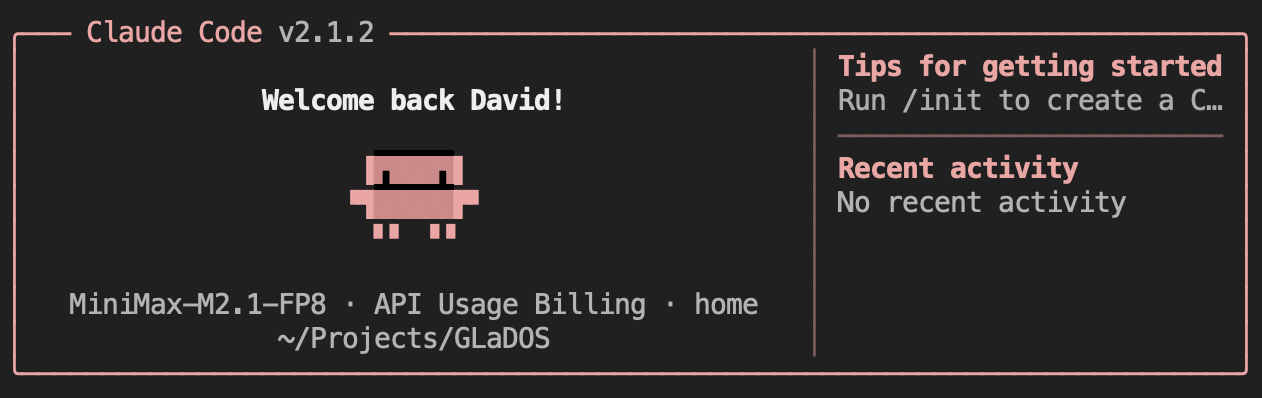
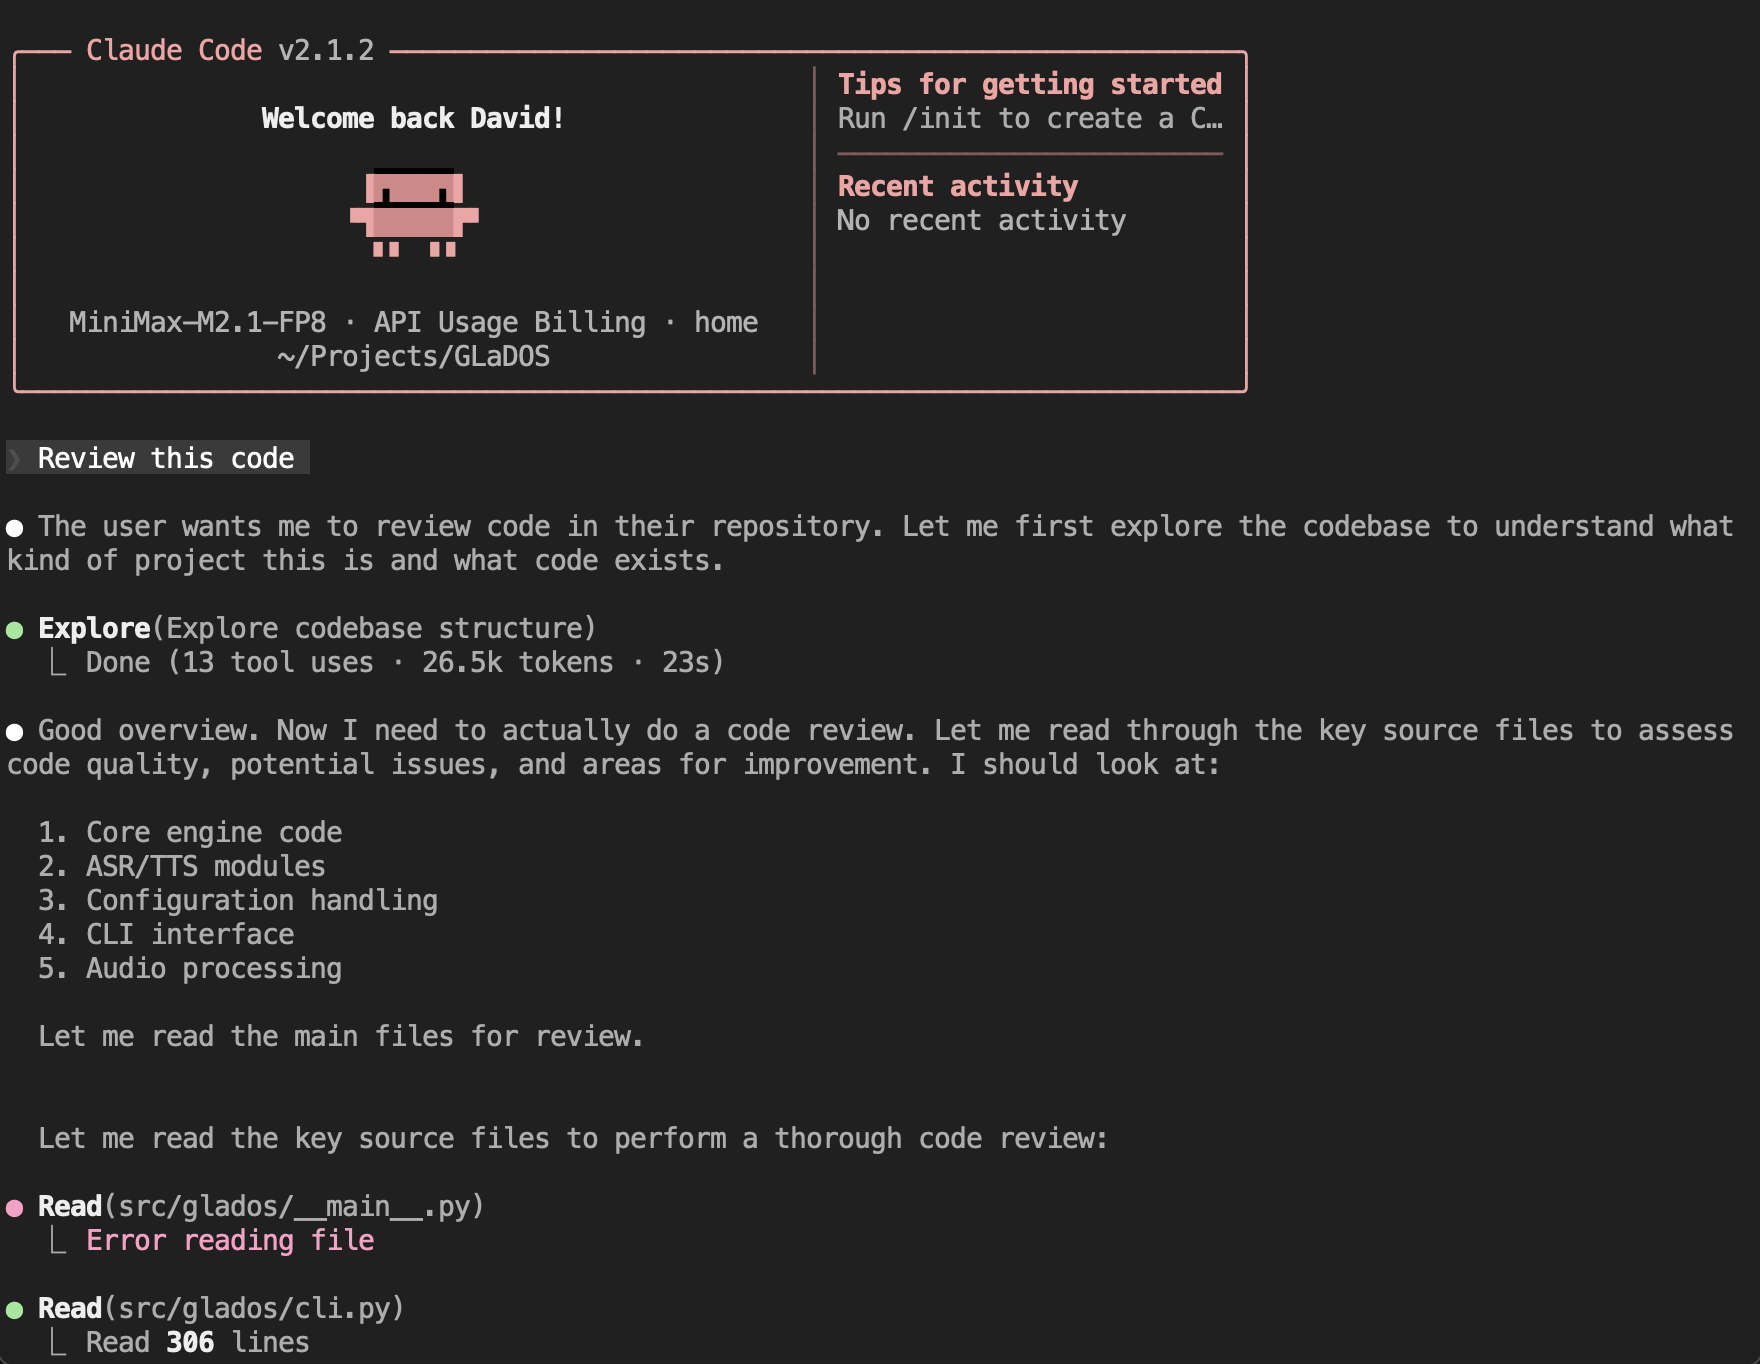
Example: Claude Code running locally
Below is a representative excerpt from a real Claude Code session using the local vLLM backend (shortened and lightly redacted). Tool calling works well. I cloned my GLaDOS repo and had claude-minimax review it:
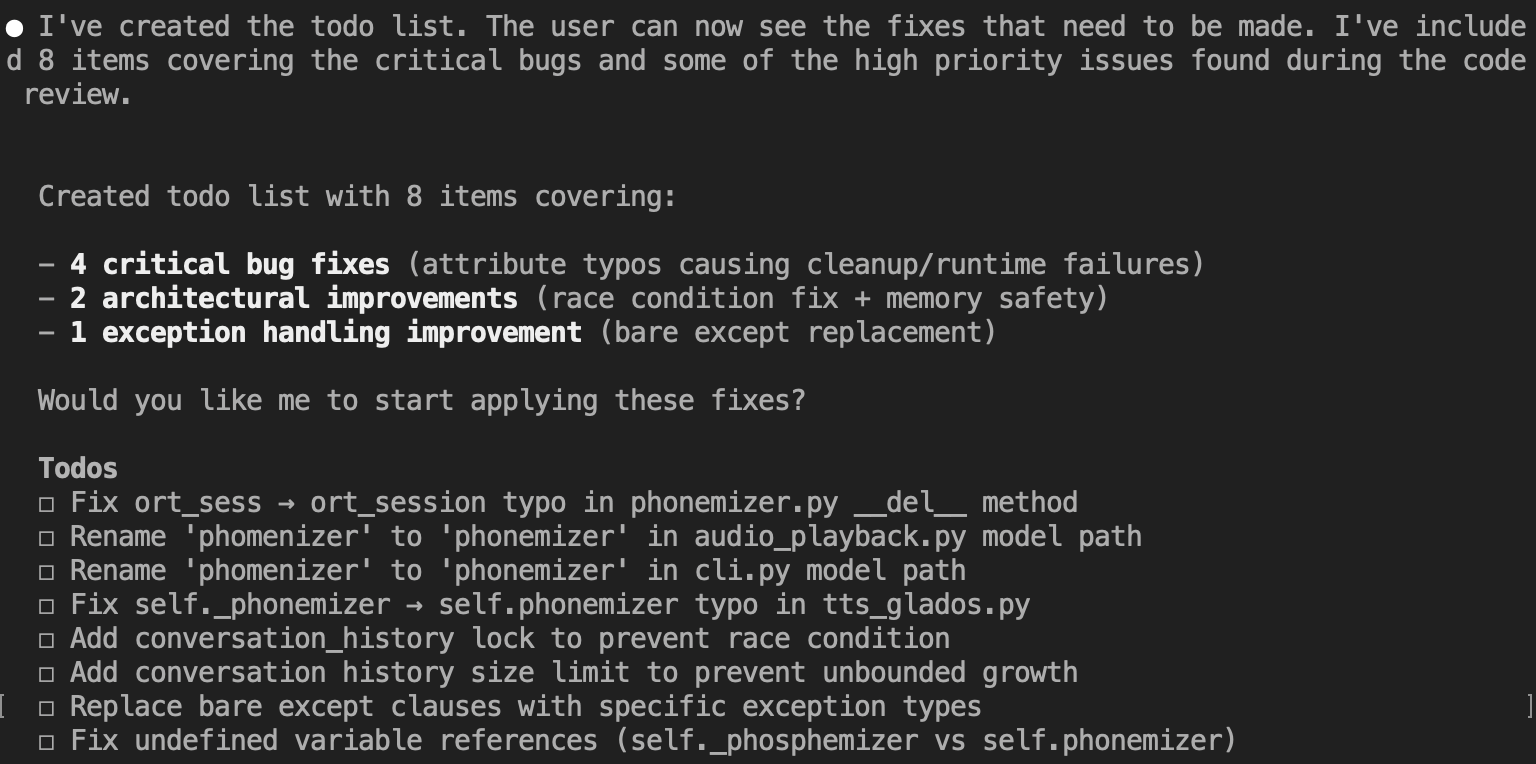
The model didn’t hold back:
And the cost summary:
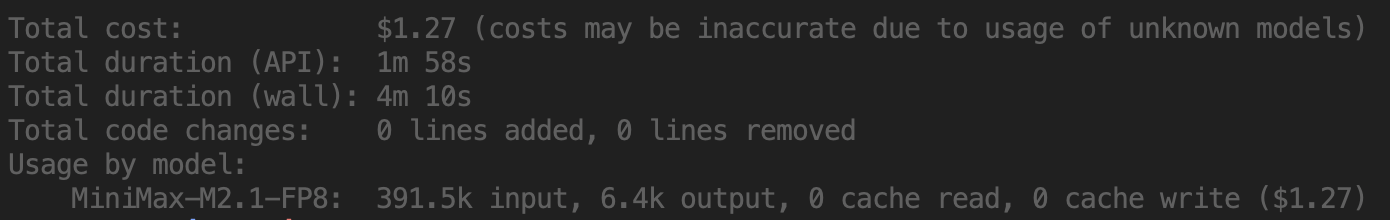
Hey, it looks like spending €9,000 on this server saved me about $1.27.
Final conclusions
Don’t assume pipeline parallel will be faster just because you don’t have NVLink. On this 140GB model + vLLM V1 + quantisation path, PP2 was both harder to fit and significantly slower.
--max-num-seqsis a real performance knob, not just a safety limit. Too low causes queueing and TTFT spikes. For this workload, 16 was the best setting.Long context is mostly KV cache capacity, not just
max-model-len. vLLM tells you directly what max concurrency you can expect at your configured max context.For Claude Code-like traffic, the winning profile was:
- high throughput on short prompts at concurrency 4–8
- stable TTFT
- long-context capability retained (even if long-context concurrency is limited)
What I’d do next: thinking mode for hard problems
If I need deep reasoning on a one-off hard problem, I have a fallback: 960GB LPDDR5 and 144 CPU cores means I can run something like DeepSeek-V3.2-Speciale locally, slowly.
Speciale is designed for deep reasoning and does not support tool calling, so it’s a bad drop-in Claude Code backend. But it can be useful as an “offline brain”: dump a long, tightly scoped context (logs, relevant files, constraints) and ask for a plan or diagnosis.
If you want to operationalise that without complicating your setup, wrap it behind MCP (Model Context Protocol) as a dedicated “deep reasoning” endpoint—callable when needed, not pretending to be a tool-using agent.
Cost summary
| What | Time/Money |
|---|---|
| GH200 “desktop” build | €9,000 (see prior post) |
| vLLM flag-tweaking | ~5 hours |
| Wasted time on PP2 | ~1 hour |
| Speed boost vs real Claude | 2.4x faster (YMMV) |
Trust the numbers. Run the experiments. And maybe, just maybe, your €9,000 AI desktop will save you that €1.27 per query. At this rate, it’ll pay for itself in… [checks calculator] …7,087 code reviews.
Now if you’ll excuse me, I have 7,086 more repos to review.
Enjoyed this deep-dive?
Get my next piece on AI hardware, biophysics, or random optimisation hacks delivered straight to your inbox.